This year marked the fifth year in a row that I developed a model to project Hall of Fame results based on publicly released ballots compiled by Twitter users/national heroes like Ryan Thibodaux—but this was probably the most uncertain year yet. Although I ultimately predicted that four players (Jeff Bagwell, Tim Raines, Iván Rodríguez, and Trevor Hoffman) would be inducted, I knew that Rodríguez, Hoffman, and Vladimir Guerrero were all de facto coin flips. Of course, in the end, BBWAA voters elected only Bagwell, Raines, and Rodríguez, leaving Hoffman and Guerrero to hope that a small boost will push them over the top in 2018. If you had simply taken the numbers on Ryan's BBHOF Tracker at face value, you would have gotten the correct answer that only those three would surpass 75% in 2017.
But although my projections weren't perfect, there is still a place for models in the Hall of Fame prediction business. In terms of predicting the exact percentage that each player received, the "smart" model (which is based on the known differences between public and private voters) performed significantly better than the raw data (which, Ryan would want me to point out, are not intended to be a prediction):
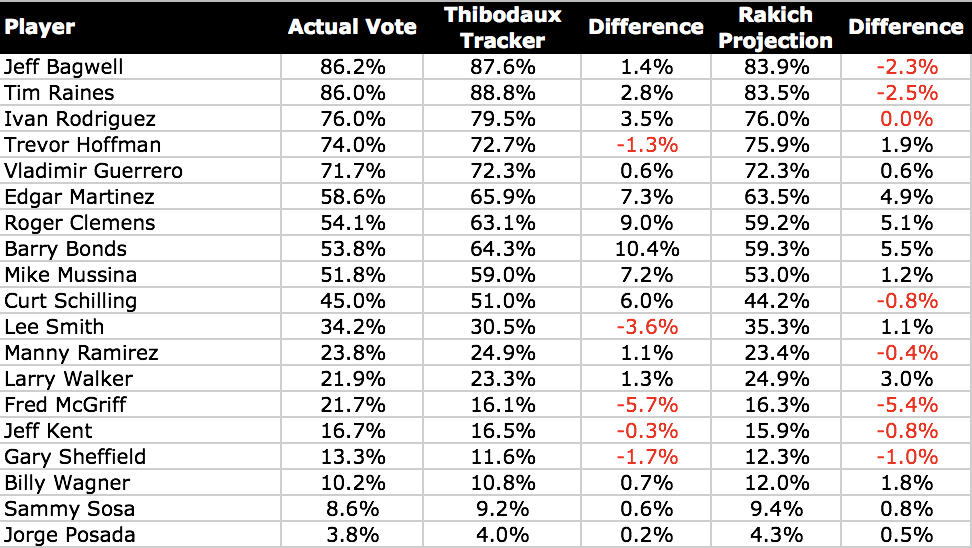
My model had an overall average error of 2.1 percentage points and a root mean square error of 2.7 percentage points. Most of this derives from significant misses on four players. I overestimated Edgar Martínez, Barry Bonds, and Roger Clemens all by around five points, failing to anticipate the extreme degree to which private voters would reject them. In fact, Bonds dropped by 23.8 points from public ballots to private ballots, and Clemens dropped by 20.6 points. Both figures are unprecedented: in nine years of Hall of Fame elections for which we have public-ballot data, we had never seen such a steep drop before (the previous record was Raines losing 19.5 points in 2009). Finally, I also underestimated Fred McGriff by 5.4 points. Out of nowhere, the "Crime Dog" became the new cause célèbre for old-school voters, gaining 13.0 points from public to private ballots.
Aside from these four players, however, my projections held up very well. My model's median error was just 1.2 points (its lowest ever), reflecting how it was mostly those few outliers that did me in. I am especially surprised/happy at the accuracy of my projections for the four new players on the ballot (Rodríguez, Guerrero, Manny Ramírez, and Jorge Posada). Because they have no vote history to go off, first-time candidates are always the most difficult to forecast—yet I predicted each of their final percentages within one point.
However, it's easy to make predictions when 56% of the vote is already known. By the time of the announcement, Ryan had already revealed the preferences of 249 of the eventual 442 voters. The true measure of a model lies in how well it predicted the 193 outstanding ones. If you predict Ben Revere will hit 40 home runs in 2017, but you do so in July after he had already hit 20 home runs, you're obviously benefiting from a pretty crucial bit of prior knowledge. It's the same principle here.
By this measure, my accuracy was obviously worse. I overestimated Bonds's performance with private ballots by 13.4 points, Martínez's by 11.5, and Clemens's by 9.8. I underestimated McGriff's standing on private ballots by 12.9 points. Everyone else was within a reasonable 6.1-point margin.

That was an OK performance, but this year I was outdone by several of my fellow Hall of Fame forecasters. Statheads Ben Dilday and Scott Lindholm have been doing the model thing alongside me for several years now, and this year Jason Sardell joined the fray with a groovy probabilistic model. In addition, Ross Carey is a longtime Hall observer and always issues his own set of qualitatively arrived-at predictions. This year, Ben came out on top with the best predictions of private ballots: the lowest average error (4.5 points), the lowest median error (3.02 points), and the third-lowest root mean square error (6.1 points; Ross had the lowest at 5.78). Ben also came the closest on the most players (six).
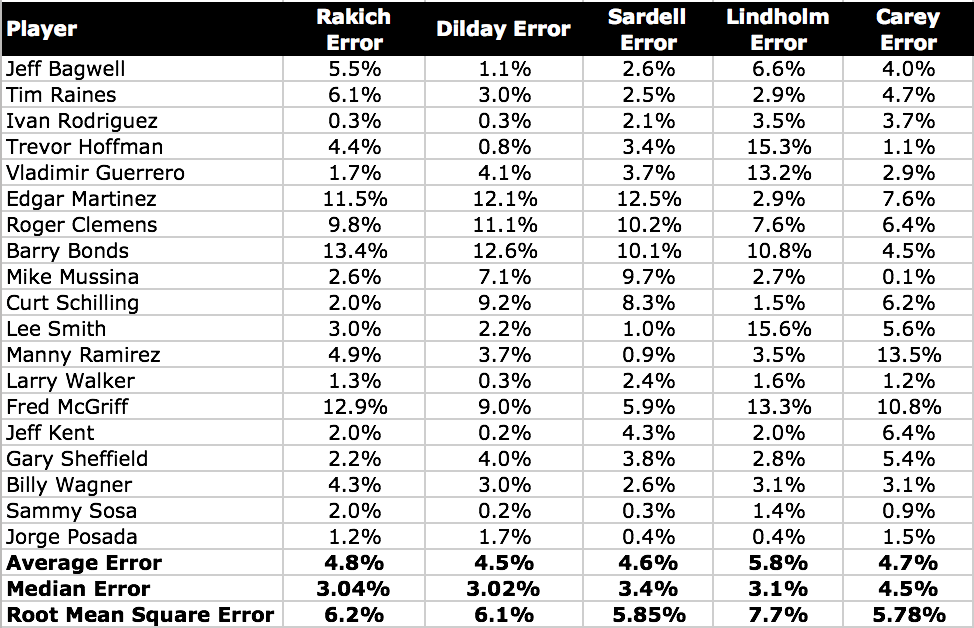
(A brief housekeeping note: Jason, Scott, and Ross only published final projections, not specifically their projections for private ballots, so I have assumed in my calculations that everyone shared Ryan's pre-election estimate of 435 total ballots.)
Again, my model performed best when using median as your yardstick; at a median error of 3.04 points, it had the second-lowest median error and darn close to the lowest overall. But I also had the second-highest average error (4.8 points) and root mean square error (6.2 points). Unfortunately, my few misses were big enough to outweigh any successes and hold my model back this year after a more fortuitous 2016. Next year, I'll aim to regain the top spot in this friendly competition!
No comments:
Post a Comment